
Note: This article is based on Firefox builds as available for download at least until August 7th, 2019. In case you want to go through those steps on your own, I cannot guarantee that it will lead to the same effects if newer builds are used.
So a couple of months ago when I was looking for some new interesting and challenging sport events, which I could participate in to reach my own limits, I was made aware of the Mega Hike event. It sounded like fun and it was also good to see that one particular event is annually organized in my own city since 2018. As such I accepted it together with a friend, and we had an amazing day. But hey… that’s not what I actually want to talk about in this post!
The thing I was actually more interested in while reading content on this web site, was the high CPU load of Firefox while the page was open in my browser. Once the tab got closed the CPU load dropped back to normal numbers, and went up again once I reopened the tab. Given that I haven’t had that much time to further investigate this behavior, I simply logged bug 1530071 to make people aware of the problem. Sadly the bug got lost in my incoming queue of daily bug mail, and I missed to respond, which itself lead in no further progress been made.
Yesterday I stumbled over the website again, and by any change have been made aware of the problem again. Nothing seemed to have been changed, and Firefox Nightly (70.0a1) was still using around 70% of CPU even with the tab’s content not visible; means moved to a background tab. Given that this is a serious performance and power related issue I thought that investigation might be pretty helpful for developers.
In the following sections I want to lay out the steps I did to nail down this problem.
Energy consumption of Firefox processes
While for the first look the Activity Monitor of MacOS is helpful to get an impression about the memory usage and CPU load of Firefox, it’s a bit hard to see how much each and every open tab is actually using.

You could try to match the listed process ids with a specific tab in the browser by hovering over the appropriate tab title, but the displayed tooltip only contains the process id in Firefox Nightly builds, but not in beta or final releases. Further multiple tabs will currently share the same process, and as such the displayed value in the Activity Monitor is a shared.
To further drill down the CPU load to a specific tab, Firefox has the about:performance page, which can be opened by typing the value into the location bar. It’s basically an internal task manager to inspect the energy impact and memory consumption of each tab.

Even more helpful is the option to expand the view for sub frames, which are usually used to embed external content. In case of the Megamarsch page there are three of those, and one actually spikes out with consuming nearly all the energy as used by the tab. As such it might be a good chance that this particular iframe from YouTube, which is embedding a video, is the problem.
To verify that the integrated Firefox Developer Tools can be used. Specially the Page Inspector will help us, which allows to search for specific nodes, CSS classes, or others, and then interact with them. To open it, check the Tools > Web Developer sub menu from inside the main menu.
Given that the URI of the iframe is known, lets search for it in the inspector:

When running the search it will not be the first result as found, so continue until the expected iframe is highlighted in the Inspector pane. Now that we found the embedded content lets delete the node by opening the context menu and clicking Delete Node. If it was the problem, the CPU load should be normal again.
Sadly, and as you will notice when doing it yourself, it’s not the case. Which also means something else on that page is causing it. The easiest solution to figure out which node really causes the spike, is to simply delete more nodes on that page. Start at a higher level and delete the header, footer, or any sidebars first. By doing that always keep an eye on the Activity Monitor, and check if the CPU load maybe has dropped. Once that is the case undo the last step, so that the causing node is getting inserted again. Then remove all sibling nodes, so only the causing node remains. Now drill down even further until no more child nodes remain.
As advice don’t forget to change the update frequency so that values are updated each second, and revert it back after you are done.
In our case the following node which is related to the cart icon remains:
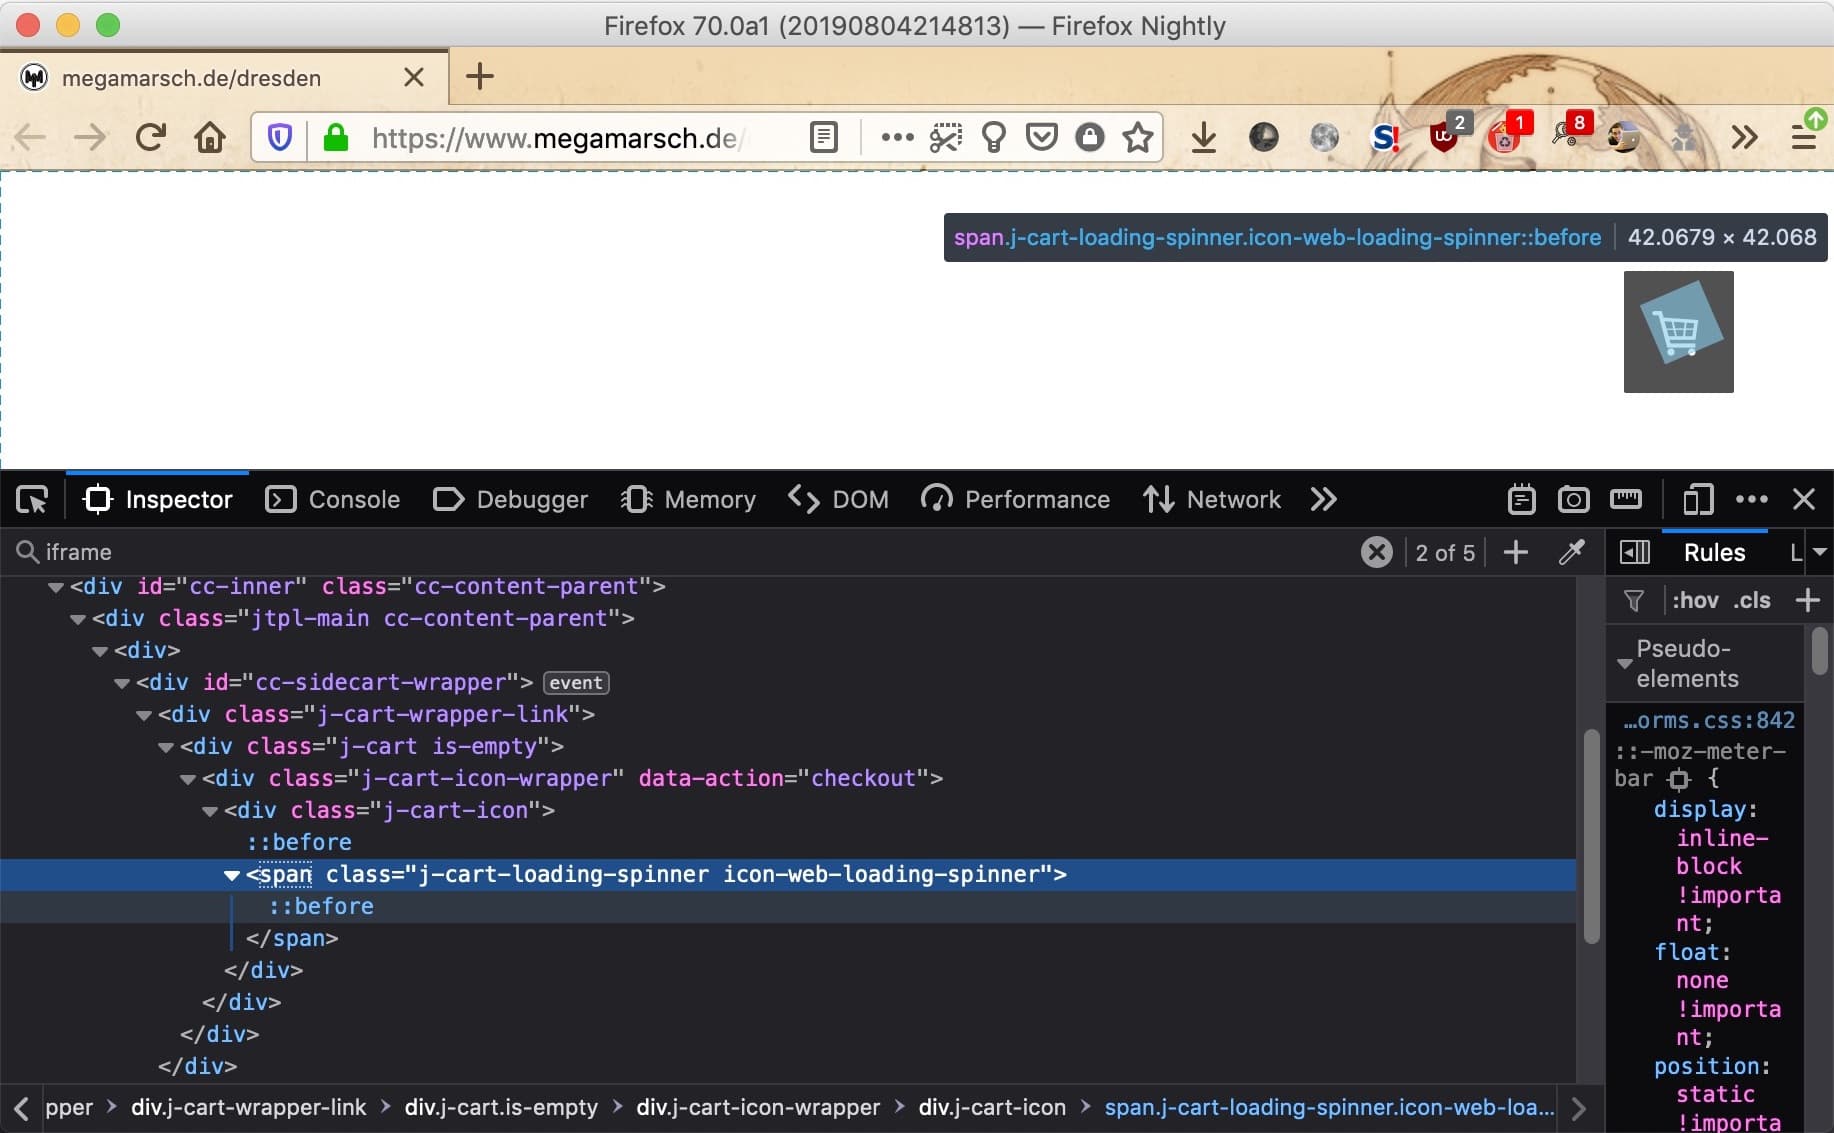
So some kind of loading indicator seems to trigger Firefox to maybe repaint a specific area on the screen. To verify that remove the extra CSS class definitions. Once the icon-web-loading-spinner class has been removed it’s fine. Note that when hovering over the node and the class still be set, a spinning rectangle which is a placeholder for the real element can even be seen.
Checking the remaining stylesheets which get included, the one which remains (after removing all others without a notable effect) is from assets.jimstatic.com. And for the particular CSS class it holds the following animation:
@keyframes spinit{
  0%{
    -webkit-transform:rotate(0deg);
    transform:rotate(0deg)
  } to {
    -webkit-transform:rotate(360deg);
    transform:rotate(360deg)
  }
}
More interesting is that this specific class defines opacity: 0, which basically means that the node shouldn’t be visible at all, and no re-painting should happen until the node has been made visible.
With these kind of information found I updated the before mentioned bug with all the newly found details, and handed it over to the developers. Everyone who wants to follow the progress of fixing it, can subscribe as part of the CC list and will be automatically notified by Bugzilla for updates.
If you found this post useful please let me know, and I will write more of them in the future.